7 Tips for Choosing Warehouse Automation Robots?
Choosing warehouse automation robots is not simply a technology purchase. It is an operational decision affecting labor, safety, throughput, and customer service.
A robot may look impressive during a polished demonstration. Your warehouse may tell a different story. Narrow aisles, uneven floors, cold storage, mixed pallets, and changing order volumes can expose hidden weaknesses. This guide presents seven practical tips for choosing warehouse automation robots that fit real working conditions.
Start with measurable needs. Record travel distances, picking rates, loading times, error patterns, and peak-season pressure. Then compare robot capabilities with those figures, not with attractive marketing promises. A reliable evaluation should include integration with your warehouse management system, barcode equipment, charging routines, maintenance access, and employee training.
Safety deserves close attention. Ask vendors for documented risk assessments, operating limits, emergency procedures, and customer references from similar facilities. Request a live trial using your containers, shelves, floor markings, and typical products. Small details matter. A robot that handles cartons well may struggle with soft bags or damaged labels.
Total cost also needs a wider view. Include software updates, spare parts, downtime, support response, energy use, and future expansion. I have seen projects focus heavily on purchase price and underestimate integration work. That mistake is expensive. The best choice may not be the fastest robot. It may be the system your team can operate confidently, maintain consistently, and improve over time. Technology changes quickly. Your evaluation should leave room for honest doubts and practical revision.
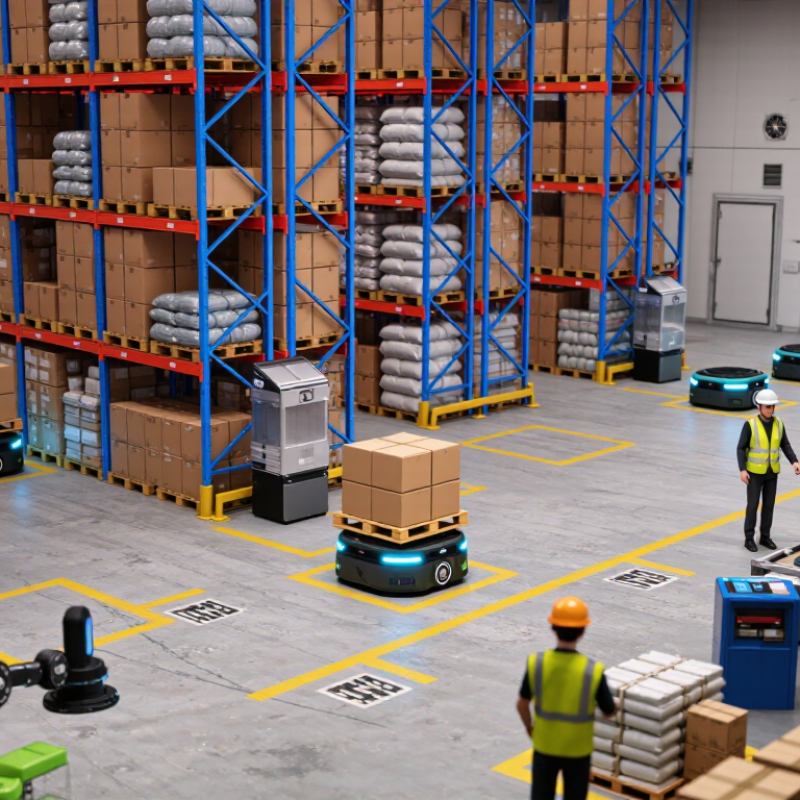
Table of Contents
[Hide]
Define Warehouse Needs: Benchmark Throughput and Safety with MHI’s 44% Robotics Adoption
Warehouse automation should begin with evidence, not excitement. The MHI 2024 Annual Industry Report reports that 44% of surveyed organizations use robotics. That figure signals adoption, not automatic success. Tip 1: measure current throughput by hour, shift, and product type. Tip 2: record walking distance, queue time, and manual touches. A busy afternoon may reveal more than a monthly average.
Tip 3: define safety limits before selecting equipment. Map pedestrian routes, rack edges, loading zones, and emergency access. Tip 4: request performance data under your real conditions, including narrow aisles and mixed cartons. The International Federation of Robotics reported 541,302 industrial robots installed worldwide in 2023, but warehouse tasks differ from factory work. Do not transfer factory assumptions blindly. That is an easy mistake.
Tip 5: test navigation near people, pallets, and temporary obstructions. Tip 6: calculate payback using labor, maintenance, training, downtime, and integration costs. Tip 7: measure recovery time after a fault. A robot that stops safely but waits hours for support can reduce throughput. In my experience, teams often overestimate perfect operating conditions. Dust appears. Labels shift. Workers improvise. Pilot tests should capture those details. Use safety observations, near-miss records, and operator feedback alongside output metrics. Recheck the benchmark after four weeks. The first number is rarely the best number.
7 Tips for Choosing Warehouse Automation Robots? - Define Warehouse Needs: Benchmark Throughput and Safety with MHI’s 44% Robotics Adoption
| Tip | Warehouse Need | Useful Benchmark or Data Point | What to Measure | Selection Implication | Readiness Check |
|---|---|---|---|---|---|
| 1 | Define the required throughput | Calculate average, peak-hour, and peak-day demand. A practical capacity target is generally 15%–25% above peak-hour demand to absorb variability. | Orders per hour, picks per hour, lines per order, order release pattern, replenishment volume, and seasonal peaks. | Select a robot system that meets peak demand without operating continuously at its theoretical maximum. | Validate performance using at least one full peak-shift simulation. |
| 2 | Match the robot to the load profile | Record the full operating envelope: load weight, dimensions, center of gravity, container type, and percentage of non-standard items. | Minimum and maximum payload, pallet or tote dimensions, fragile-item ratio, barcode quality, and load stability. | Avoid selecting equipment based only on the average load; the robot must safely handle the upper limit and common exceptions. | At least 95% of intended loads should fit the standard operating envelope; exceptions need a defined manual process. |
| 3 | Benchmark travel and dwell time | Total cycle time should include travel, acceleration, pickup or drop-off, queueing, scanning, charging, and system communication delays. | Average mission time, 95th-percentile mission time, queue time, empty travel, station dwell time, and traffic-related delays. | Prioritize fleet orchestration, route optimization, and station balancing when congestion contributes more delay than travel. | Keep average robot utilization below approximately 80%–85% during the design peak to preserve recovery capacity. |
| 4 | Prioritize worker and pedestrian safety | Use a documented risk assessment, protective separation, speed control, emergency stops, warning systems, and safe access points. There is no universal “safe speed” without context. | Pedestrian crossings, near misses, emergency-stop response, blind corners, aisle width, floor condition, and interaction with forklifts. | Choose robots with configurable safety zones and operating modes suited to mixed human–robot traffic. | Complete risk assessment, validation testing, operator training, and documented emergency procedures before production use. |
| 5 | Check facility and infrastructure fit | Verify floor flatness, aisle clearance, turning radius, charging capacity, network coverage, lighting, fire protection, and temperature conditions. | Floor slopes and joints, minimum aisle width, Wi-Fi coverage, charging locations, power availability, and environmental limits. | A lower-speed or infrastructure-tolerant solution may outperform a faster robot that requires expensive facility modifications. | Complete a site survey and identify every required civil, electrical, network, and fire-safety modification. |
| 6 | Evaluate integration and data quality | Automation performance depends on reliable inventory, location, order, and exception data. Test interfaces under normal and peak transaction loads. | Inventory accuracy, scan success rate, API response time, order-release latency, exception frequency, and system downtime. | Prefer open interfaces, clear event logs, role-based access, and a defined fallback process for network or software outages. | Establish a baseline of at least 98% inventory-record accuracy before using automation to scale operations. |
| 7 | Measure reliability, scalability, and total cost | A commonly cited industry survey benchmark reports 44% robotics adoption among responding organizations. Adoption alone does not prove economic fit. | Availability, mean time between failures, mean time to repair, battery or charging performance, labor hours saved, maintenance cost, and payback period. | Compare total cost of ownership over the planned life cycle, including software, integration, training, spare parts, energy, and facility changes. | Run a controlled pilot with predefined targets for throughput, safety, uptime, exception rate, and return on investment. |
Planning note: Throughput and utilization figures are design benchmarks rather than universal guarantees. Final targets should be confirmed through site-specific testing, a formal safety risk assessment, and peak-demand simulation.
Related Posts
-
How to Choose the Right Service Robot for Your Business?
-
Top 10 Warehouse Robots Transforming Supply Chain Efficiency?
-
10 Best Warehouse Robots for Global Buyers?
-
What Are Warehouse Robots and How Do They Work?
-
Top Warehouse Robots in 2026 What to Buy and Why?
-

What Is the Best AI Robot Manufacturer in China?
Customers




Smart Robotics brand movie
Watch video