How to Choose Robotic Automation in 2026
Choosing robotic automation in 2026 is less about buying the newest robot and more about matching a system to real work. A compact collaborative arm may suit a repetitive packing task, while a mobile robot could help move totes across a busy warehouse. The right choice depends on cycle time, payload, reach, floor conditions, and how often products change. Small details matter. A narrow aisle, reflective packaging, or an uneven shift schedule can disrupt a plan that looked sound in a sales demo.
Start with the task, not the machine. Measure current throughput, error rates, changeover time, and the minutes workers spend on strenuous or repetitive steps. Then compare options using a pilot on the actual production floor. Ask how the system handles jams, tool changes, network interruptions, and routine maintenance. Request evidence from comparable deployments, not only projected savings. A supplier’s performance figures are useful, but they should be checked against your own operating conditions.
There is no flawless selection process. Early estimates can miss integration work, training needs, or the cost of stopping production during installation. That deserves a second look. Involve operators, maintenance staff, safety professionals, and IT before setting requirements. Their practical observations often reveal constraints a spreadsheet misses. Evaluate the full lifecycle, including service access, spare parts, software updates, and support response times. The best robotic automation investment is not always the most capable system; it is the one your team can operate reliably, adapt as work changes, and justify with measured results. Begin with a clear baseline, a defined pilot, and honest criteria for success.
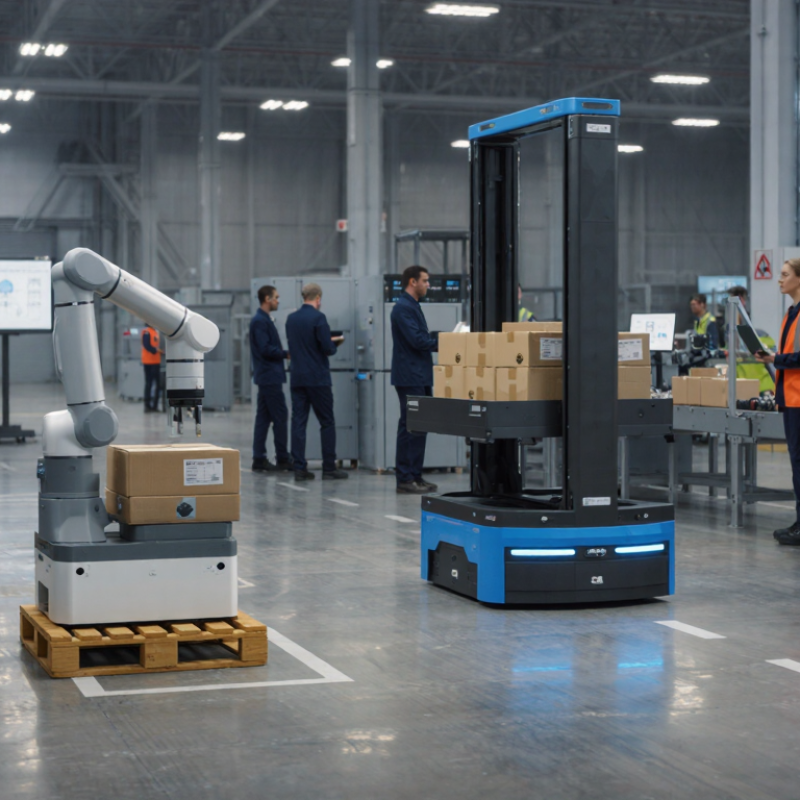
Table of Contents
[Hide]
Define Automation Goals and Success Criteria
Before comparing robotic systems, define the task and the problem the investment must solve. Observe the process during a normal shift, not only during a polished demonstration. Record cycle time, changeovers, defects, stoppages, and operator interventions for several weeks. Small details matter. A part arriving slightly skewed can turn a fast cell into repeated manual resets. Set a baseline using the same product mix and shift conditions you will use later. Otherwise, an apparent improvement may reflect easier work, not better automation.
Turn goals into success criteria with an owner, a measurement method, and a review period. For example, a pilot might target a 15% reduction in median cycle time while maintaining first-pass quality above 98% and limiting unplanned downtime. Treat these as site-specific thresholds, not universal benchmarks. Include recovery time after jams, safe maintenance access, and time required to change tooling. Track performance during both peak and quiet weeks. Operators and maintenance staff can reveal awkward reaches, confusing alarms, or difficult resets. Be candid about trade-offs: a faster cycle may increase scrap or supervision needs. Plans can look too neat on paper; challenge early estimates and decide what evidence would prompt a pause or adjustment.
How to Choose Robotic Automation in 2026 - Define Automation Goals and Success Criteria
| Decision Dimension | What to Assess | Measure or Evidence | Success Criteria to Define |
|---|---|---|---|
| Business goal | Identify the primary reason for automation: improving output, reducing repetitive manual work, increasing consistency, addressing labor constraints, or improving workplace safety. | Document the current operating problem and its effect on cost, delivery, quality, or employee workload. | State one primary outcome and any secondary outcomes before comparing automation options. |
| Task suitability | Review how often the task occurs, how repetitive it is, and how much variation exists in parts, products, or work sequences. | Observe representative production cycles; record task frequency, changeovers, exceptions, and manual interventions. | Define the acceptable range of variation and the conditions under which the system must stop or request assistance. |
| Process readiness | Check whether inputs, work instructions, tooling, part presentation, and upstream and downstream processes are stable. | Use process maps, defect records, changeover logs, and observations across normal operating conditions. | Resolve or explicitly account for unstable process steps before setting the automation scope. |
| Capacity and cycle time | Determine required production volume, available operating time, shift patterns, and the pace of connected processes. | Measure baseline cycle time and throughput, including loading, unloading, changeovers, stoppages, and recovery time. | Set a required output rate that meets demand without creating a bottleneck elsewhere in the process. |
| Quality performance | Identify the defects the automation is expected to prevent, detect, or reduce, and distinguish robot performance from process quality. | Track first-pass yield, defect rate, rework, scrap, and inspection results using a consistent measurement period. | Specify the required quality level and how defects or inspection failures will be recorded and handled. |
| Technical feasibility | Assess reach, payload, speed, positioning needs, end-of-arm tooling, sensing, and the work environment. | Compare task requirements with documented equipment specifications and validate the application through a feasibility study or trial. | Confirm that the proposed system can perform the full task, including part variation and required recovery actions. |
| Safety and risk | Evaluate hazards from robot motion, tooling, workpieces, pinch points, access, and interaction with people. | Complete a task-based risk assessment covering normal operation, setup, maintenance, jam clearing, and foreseeable misuse. | Define risk-reduction measures, access controls, safe operating modes, and responsibilities for validation before production use. |
| Integration and data | Determine how the automation will exchange signals and data with existing equipment, production systems, and quality records. | Document required interfaces, event logs, downtime codes, traceability fields, and ownership of data. | Confirm that production status, faults, and required quality data can be captured and used by the relevant teams. |
| Economic case | Include the full lifecycle cost, not only the purchase price. | Estimate integration, tooling, installation, training, maintenance, energy, consumables, downtime, and support costs alongside expected benefits. | Calculate payback period as initial investment divided by expected net periodic savings; document assumptions and sensitivity to volume and utilization. |
| Workforce and maintainability | Plan for operator training, maintenance skills, troubleshooting, spare parts, and responsibility for system performance. | Define required competencies, training time, maintenance tasks, escalation paths, and recovery procedures. | Confirm that the site can operate and maintain the system safely with available or planned resources. |
| Pilot and acceptance | Test the intended application under representative operating conditions before full deployment. | Record output, cycle time, quality, unplanned stops, manual interventions, changeover performance, and safety-related observations. | Set acceptance limits in advance, measure against the same baseline and time period, and document unresolved exceptions. |
| Scale and resilience | Consider product changes, demand variation, future line expansion, and what happens when the automated cell is unavailable. | Review changeover requirements, capacity headroom, recovery plans, maintenance windows, and backup operating procedures. | Define how the system will adapt to expected changes and how production will continue during faults or planned maintenance. |
Measurement note: Establish a representative baseline before setting numerical targets. There is no single throughput, payback, or quality threshold that is appropriate for every process; targets should reflect the application, operating conditions, and business case.
Related Posts
-
Top 10 Innovations in Robot Technology Shaping Our Future?
-
How to Choose the Right Industrial Robots for Your Business?
-

Top 10 Industrial Robots You Should Consider for Your Business?
-
2026 Best Robot Technology Innovations for Global Buyers?
-

What Is the Best AI Robot Manufacturer in China?
-
How to Choose the Right Robotic Solutions for Your Business?
Customers




Smart Robotics brand movie
Watch video