How to Choose the Best Air Monitoring System?

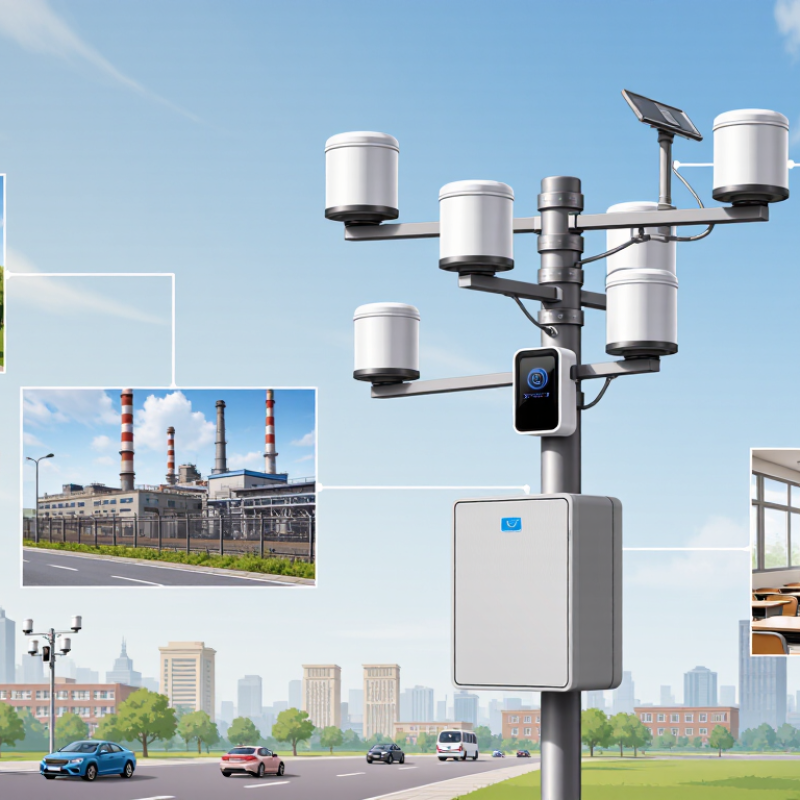
Choosing the best Air Monitoring system starts with a clear question: what do you need to measure, and where? A roadside station, a factory boundary, and a school classroom have different priorities. Each setting brings its own pollutants, weather conditions, and practical limits.

The scale of the challenge is significant. The World Health Organization’s 2022 air quality database reported that 99% of the global population lived in places exceeding its air quality guideline limits. This figure describes exposure, not the performance of any particular device. Still, it shows why reliable measurements matter. The WHO’s Global Air Quality Guidelines also identify pollutants such as particulate matter and nitrogen dioxide as important health concerns.

The US Environmental Protection Agency’s Enhanced Air Sensor Guidebook recommends defining monitoring goals before selecting sensors. That means deciding which pollutants matter, what concentration range is expected, and how often data must be collected. Not every site needs a laboratory-grade analyzer. Nor will a low-cost sensor answer every question. A useful comparison should examine accuracy, calibration needs, detection limits, weather protection, connectivity, maintenance, and total operating cost. A neat dashboard can still hide weak data. That is easy to overlook.

This guide explains how to match system capabilities to real-world monitoring needs. It also considers installation details, such as mounting sensors away from exhaust outlets and checking power access before deployment. No single system is best for every site. The right choice depends on the question, the conditions, and the quality of evidence you need.
How to Choose the Best Air Monitoring System?

Define the Monitoring Objectives and Required Air Quality Data

Before comparing instruments, write down the decision the data must support. An office team may need to know whether afternoon headaches coincide with rising carbon dioxide, while a facilities manager may track fine particles near a loading area. These are different questions. One calls for occupancy and ventilation context; the other needs particle measurements and careful placement away from direct exhaust. Name the people, rooms, and actions involved.

Then specify the pollutants and ranges that matter. Common targets include PM2.5, PM10, carbon dioxide, carbon monoxide, ozone, and volatile organic compounds, but no system measures every contaminant equally well. Choose only relevant channels. Set a sampling interval, operating period, and data resolution to match the decision: a brief peak may disappear in hourly averages. Also define acceptable uncertainty and how often sensors need checks or calibration. Those details are easy to overlook.

Map each sampling point before installation. Record height, distance from doors or vents, nearby activities, and outdoor conditions; a sensor beside a supply grille can misrepresent a whole room. Decide whether you need live alerts, trend reports, or both, and who will review them. Keep a simple log of maintenance work and unusual events. Without that context, a sharp reading may reflect a cleaning task or an open window rather than a persistent air quality problem. That distinction is not always obvious.

Identify the Pollutants and Measurement Ranges to Track

How to Choose the Best Air Monitoring System?

Identify the Pollutants and Measurement Ranges to Track

Start with the question your monitoring program must answer. A roadside study may prioritize nitrogen dioxide and fine particles, while a workshop may need sensors for specific gases and dust. The World Health Organization’s 2021 air quality guidelines set annual PM2.5 at 5 µg/m³ and the 24-hour level at 15 µg/m³. These values help define useful low-concentration performance. Not just the average. Consider short peaks, too.

Choose a measurement range that covers expected background levels and likely spikes without sacrificing resolution at the low end. A sensor designed for high concentrations may miss meaningful changes in cleaner indoor air. Check its detection limit, accuracy, response time, and calibration interval. Review cross-sensitivity data as well; some gas sensors can respond to more than one compound. This choice is less tidy than it sounds: real sites change with weather, traffic, and ventilation. Match the instrument to the site, not just a pollutant list.

Tips: Write down each target pollutant, expected minimum and maximum, averaging period, and reporting unit before comparing systems. For context, the WHO guideline gives NO2 an annual level of 10 µg/m³ and a 24-hour level of 25 µg/m³. Confirm that the instrument’s stated range and uncertainty support the decisions you need to make.

How to Choose the Best Air Monitoring System? - Identify the Pollutants and Measurement Ranges to Track

Compare the target pollutants, measurement methods, and example instrument ranges below. Ranges are illustrative, not universal: confirm the required detection limit, accuracy, certifications, and operating conditions for the specific application.

Pollutant or Parameter Example Measurement Range Common Measurement Method Where It Is Often Monitored Selection Considerations
PM2.5
Fine particulate matter
About 0–1,000 µg/m³ for some optical instruments Optical light scattering; reference methods may use filter-based gravimetric measurement Ambient air, indoor air, smoke and process areas Check low-concentration sensitivity and how humidity, particle composition, and aerosol type affect readings. Use an appropriate reference method when regulatory comparability is required.
PM10
Inhalable particulate matter
About 0–10,000 µg/m³ for some optical instruments Optical light scattering or size-selective filter sampling Dusty workplaces, construction, ambient air and industrial processes Confirm the instrument’s particle-size response and inlet design. A high upper range should not come at the expense of adequate resolution at expected concentrations.
Carbon monoxide (CO) Common analyzer ranges include 0–50 ppm or 0–500 ppm Electrochemical sensing or nondispersive infrared (NDIR) Combustion areas, garages, boiler rooms and indoor environments Choose a range and alarm settings suited to the applicable exposure limits and expected peaks. Check cross-sensitivity, response time, and calibration requirements.
Nitrogen dioxide (NO2) About 0–1 ppm for some ambient analyzers; higher ranges are available for workplace instruments Chemiluminescence analyzer or electrochemical sensor Traffic-related air, combustion sources and occupational areas Ambient monitoring may require very low detection limits. For electrochemical sensors, review potential interference from other gases and the need for periodic calibration.
Ozone (O3) About 0–1 ppm for many monitoring applications Ultraviolet photometry or electrochemical sensing Ambient air, sterilization areas and ozone-generating processes Select sensitivity appropriate to ambient or process levels. Check interference from other oxidizing gases and whether the instrument is suitable for continuous outdoor use.
Sulfur dioxide (SO2) About 0–1 ppm for some ambient analyzers; higher ranges are available for source monitoring Ultraviolet fluorescence or electrochemical sensing Combustion emissions, industrial sites and ambient air Match the range to expected concentrations and required detection limits. Consider sample-line materials, moisture management, and interference risks.
Volatile organic compounds (VOCs)
Total VOC indication
About 0–20 ppm, often reported as isobutylene equivalent, on some PID instruments Photoionization detector (PID) Solvent use, leak surveys, indoor investigations and industrial hygiene screening A PID reading is not a compound-specific identification. Response varies by chemical; use suitable correction factors and laboratory analysis when individual compounds must be quantified.
Carbon dioxide (CO2) Common indoor-air ranges include 0–5,000 ppm or 0–10,000 ppm Nondispersive infrared (NDIR) Occupied buildings, ventilation assessments and controlled environments CO2 can help assess ventilation patterns but is not a direct measurement of all indoor pollutants. Consider accuracy, sensor placement, and outdoor baseline levels.
Hydrogen sulfide (H2S) Common instrument ranges include 0–100 ppm; lower-range options may be available Electrochemical sensing or colorimetric detector tubes Wastewater facilities, confined spaces, oil and gas operations, and process areas For worker protection, choose a suitable personal or area monitor and configure alarms according to applicable rules. Check sensor service life and cross-sensitivity.

Practical tip: Define the monitoring purpose first—ambient compliance, occupational exposure, process control, or indoor-air screening. Then verify the detection limit, full-scale range, accuracy, response time, data-logging needs, calibration plan, and applicable standards for each target pollutant.

Assess Site Conditions, Sampling Needs, and System Placement

Choosing an air monitoring system starts with a close look at the site, not a catalogue. Note nearby roads, loading areas, vents, and trees that may redirect airflow. Record typical wind direction, temperature, humidity, and dust levels. A sheltered wall can protect equipment, but it may also distort readings. Small details matter.

Define what needs measuring, where, and how often. A short-term survey may need different sampling intervals than continuous trend tracking. Check the expected concentration range, required detection limits, and whether measurements must represent a room, work area, or outdoor boundary. Then choose an inlet location with clear airflow and safe access for maintenance. Keep it away from direct exhaust plumes unless that source is specifically under study. Height and distance should reflect the monitoring goal, not convenience alone. There is no perfect placement.

Before installation, map power, communications, weather protection, and service access. Compare readings with a reference instrument when practical, and document the inlet height and nearby obstructions. Revisit the setup after seasonal changes or construction; a location that worked in spring may behave differently in winter. Field judgment is useful, but it can be wrong. Record uncertainties and adjust the plan when evidence changes.

Choosing an Air Monitoring System: PM2.5 Measurement Range

The chart shows the upper PM2.5 concentration limit for each U.S. Air Quality Index (AQI) category. Choose a monitor with a suitable measurement range and time resolution for the pollutants and conditions at your site. For representative sampling, place the inlet where air can circulate freely and away from obstructions or nearby sources that could skew readings.

PM2.5 concentration limits are in µg/m³. AQI breakpoints are a reference for measurement range—not a substitute for assessing site conditions, sampling needs, or monitor placement. Source: U.S. EPA, PM2.5 AQI breakpoints.

Compare Sensor Accuracy, Calibration, and Data Management Features

A reliable air monitoring system is more than a sensor with a low price. Check its accuracy across the conditions where it will operate, including humidity, temperature, and changing particle levels. The World Health Organization’s 2021 air quality guidelines set annual PM2.5 at 5 μg/m³ and the 24-hour level at 15 μg/m³. These values show why small measurement errors can affect how readings are interpreted. Small differences matter.

Calibration deserves equal attention. Ask how often the instrument needs calibration, what reference method supports it, and whether drift is recorded over time. The U.S. Environmental Protection Agency’s 2022 Air Sensor Guidebook recommends evaluating sensors in their intended setting and comparing results with reference-grade monitoring. A controlled test alone may not reflect a dusty workshop or a damp outdoor site. No sensor stays perfect. Even good equipment needs checking.

Tips: Before buying, request calibration records, accuracy data, and a sample data export. Check whether readings include timestamps, units, and quality flags. Confirm that staff can retrieve and share historical data without special tools. If a vendor cannot explain how missing or unusual readings are handled, pause and ask again. Some data platforms look simple until the first sensor drops offline.

Evaluate Compliance, Maintenance, and Total Ownership Costs

Choosing an air monitoring system starts with the decision its data must support. Compliance monitoring may require approved methods, documented calibration, and traceable records; a low-cost sensor is not automatically a substitute. The U.S. EPA’s Enhanced Air Sensor Guidebook (2022) describes many low-cost sensors as costing under $2,500. That figure is only an entry point. It does not include reference checks, siting work, data review, or staff time. EPA’s ambient monitoring rules use 75% data-completeness criteria for many regulatory calculations. A few weeks of missing readings can therefore matter. That matters.

Maintenance is where ownership costs become visible. Ask how often filters, inlets, or other consumables need replacement, and whether calibration requires shipping or an on-site visit. Check the price of labor, software, connectivity, and spare parts over the expected service life. Then estimate the cost of downtime: a monitor awaiting service cannot produce usable data. A simple spreadsheet helps, though its assumptions deserve scrutiny. Humidity, dust, and seasonal temperature swings can change performance; local collocation with a reference instrument may reveal problems before they distort a report. Not just purchase price. Compare systems using the same operating period and data-quality target, and keep a reserve for unexpected repairs.

Smart Robotics brand movie

Watch video